The Wardrobe Diary Project
Since 1 January 2018 I have logged every piece of clothing I wear, every day – here is that data, shared openly to inspire you to explore the real cost and sustainability of your own wardrobe.
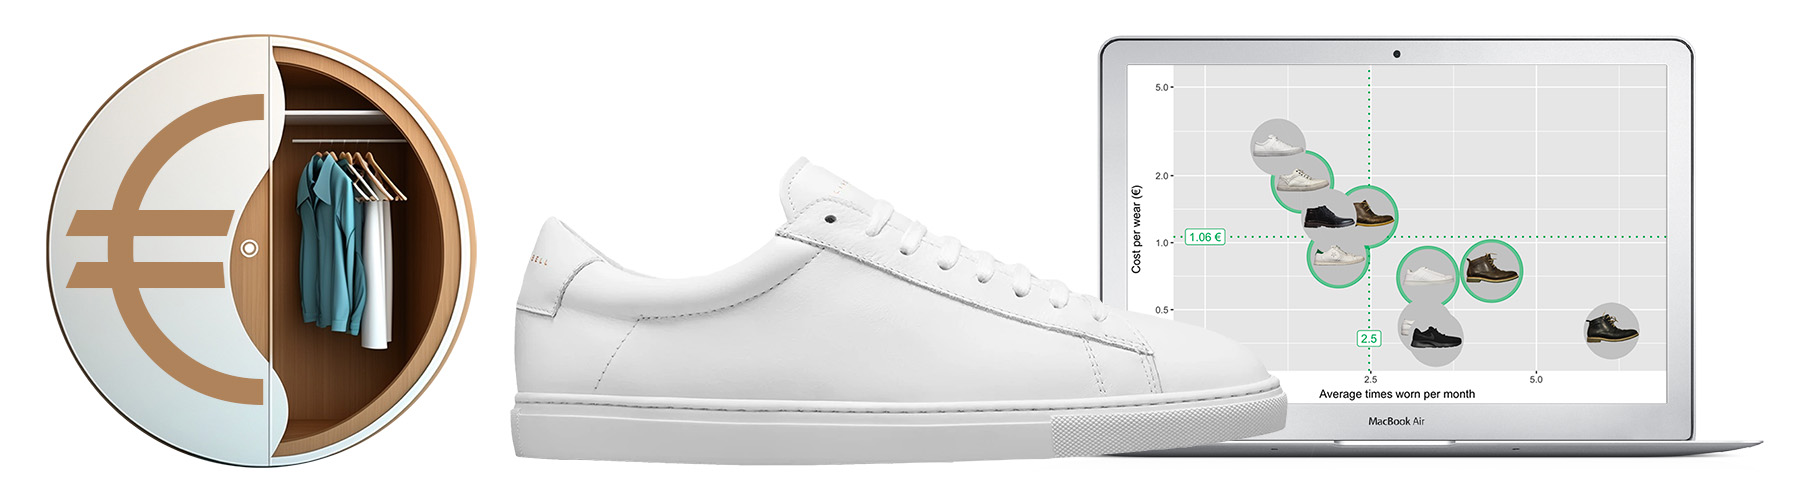
Showing the real cost of clothes
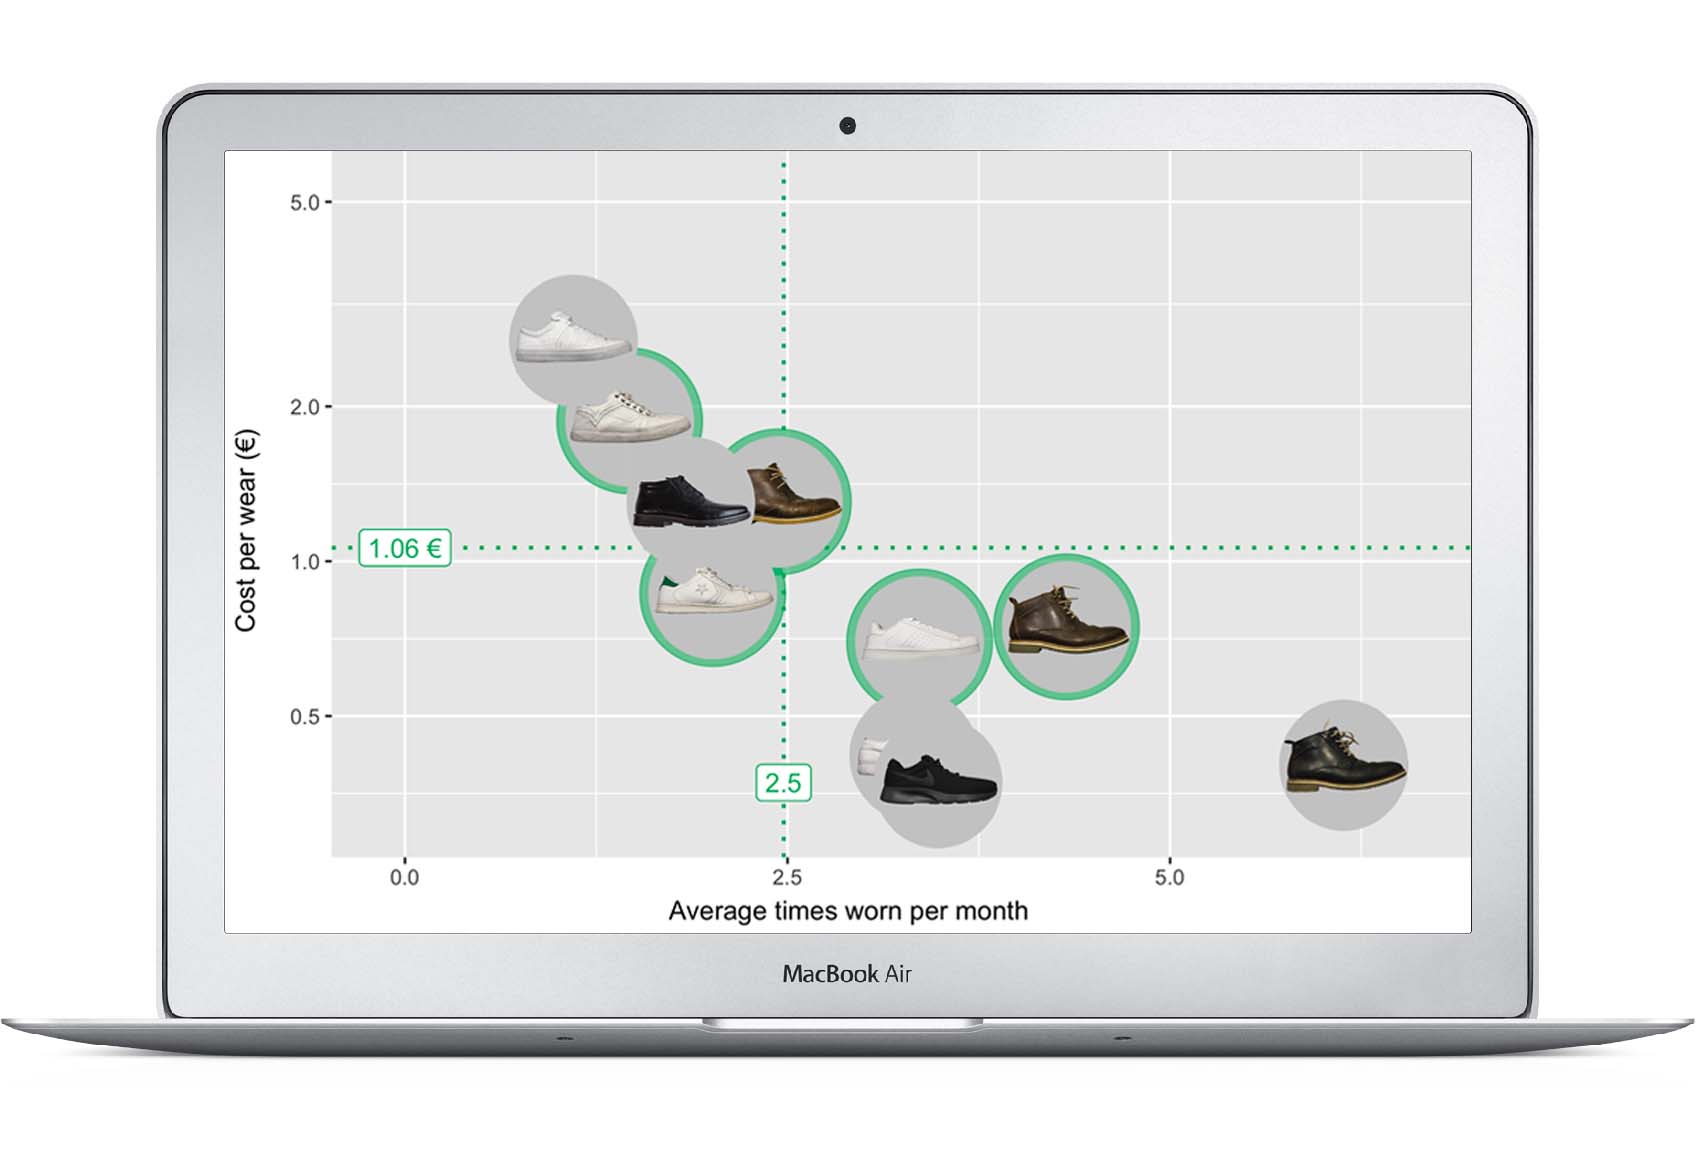
The Wardrobe Diary project started as my personal attempt to build a proper understanding of the real cost and eventually environmental impact of my use of clothes. The data set on this site is a continuous daily log of my own use of each piece of garment since 1 January 2018. In addition to showing the real cost per wear and frequency of use for each garment, this enables studying the correlation between price and quality (as measured by durability), as well as actual vs imagined use. A version for anyone to track their own wardrobe is in the works.
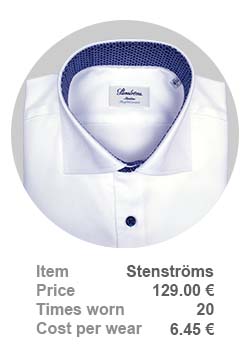
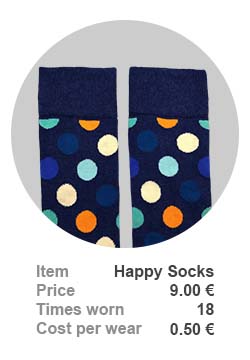
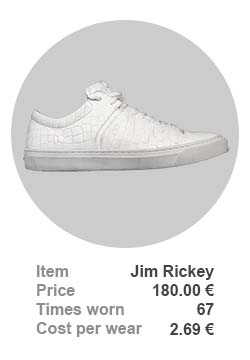
Making data-supported consumption choices
Visibility into item-level cost efficiency has been eye-opening in many ways. My main goal is not to drive down cost though, but to make better consumption choices especially from a sustainability perspective. This means only buying what I need, actually using what I have, and taking good care of each item to maximise its lifetime. Visibility helps in uncovering and quantifying opportunities for improvement, but also provides justification and peace of mind in choices that might otherwise keep feeling questionable.
Insights and learnings
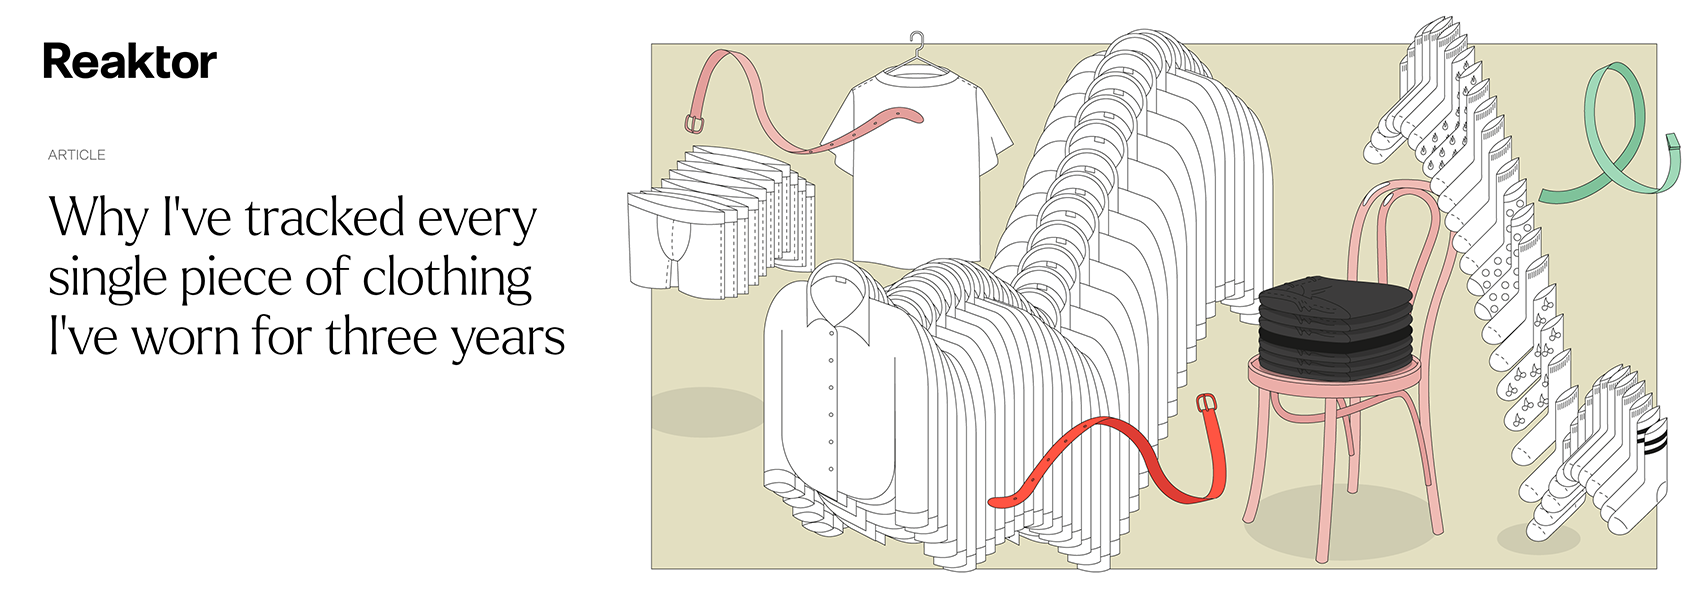
For a more elaborate story of my insights, learnings, and behavior change, please see my blog post Why I’ve tracked every single piece of clothing I’ve worn for three years.
Media coverage
I’m humbled and inspired by all the interest and engagement this project is getting among consumers and fashion brands and retailers alike. It has been picked up by many prominent media outlets. Here is some of the media coverage from different perspectives. If you would like to hear more about the project and the consumer insights generated, please send me a note and I’ll get back to you asap. My contacts are at the bottom of this page.










Expanding comparability to all spending
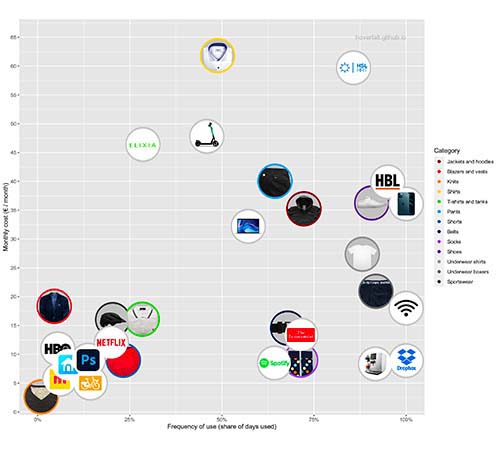
Since the use data is exhaustive both in terms of items and time, each category (kind of clothing) and the portfolio (entire wardrobe) describe the “utility of clothes”. This makes clothes comparable to not only other types of physical assets that deteriorate with use, but to service models providing any kind of continuous utility, be it physical or intangible, metered or flat rate. This in turn enables evaluating consumption alternatives and choices across types of spending and across business models.
Open data, explained
All the data on this site is open, and its meaning is written down. A machine-readable semantic layer defines every term and every figure: a glossary, a model of how each figure is calculated, traceable down to the code and the tests that check it, and a data catalog with lineage, access rights and quality checks that run every night. The same definitions are served to AI assistants through an MCP server, so they can explain where each number comes from.
Does that make AI answers more reliable? In a first experiment, an AI model answered 7 of 30 questions correctly from the raw data, 29 with the governed tools, and all 30 with the tools and the definitions. It was a single run, so read it as an illustration; the method and caveats are on the evaluation page.
- Glossary: what every term means
- Model: the conceptual model and every metric's formula
- Data catalog: datasets, lineage, data contracts and live quality checks
- AI evaluation: raw data vs governed tools vs tools with the semantic layer
- Connect your AI assistant:
https://wardrobediary.io/mcpis a public, read-only MCP server (e.g. in Claude: Settings → Connectors → Add custom connector) - Source on GitHub: the app, the semantic layer and the tests (open source)
Contacts
If you like what you have seen, or really don’t for that matter, please let me know! Send me a note and I’ll get back to you asap 👋
 linkedin.com/in/hoverfalt
 instagram.com/hoverfalt
 github.com/hoverfalt/wardrobe-diary